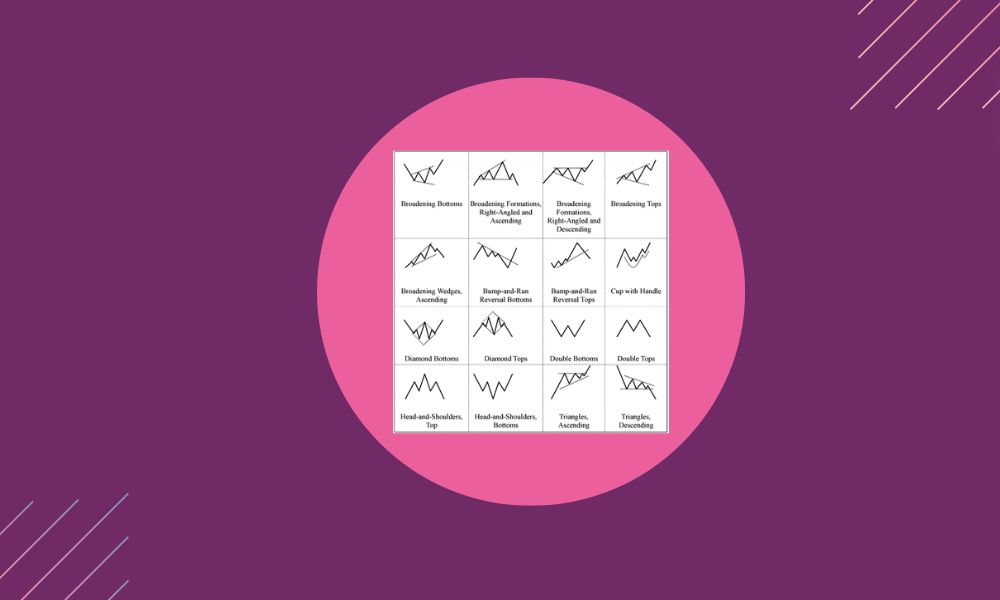
One category of price reversal patterns is known as the double top and double bottom. The formation of these reversal chart patterns takes place over a longer length of time.
The formation of a double top is similar to an M pattern and suggests a bearish reversal, whereas the formation of a double bottom is similar to a W pattern and suggests a bullish reversal.

Chart patterns known as "Double Top" and "Double Bottom" are often created when there has been a sequence of successive rounded tops and bottoms.
After a downward pattern has been established, a bullish reversal chart pattern known as a double bottom might appear on the chart.
This pattern is generated when there are two lows that occur below the level of resistance, which is also referred to as the neckline.
After an extended period of falling prices, the initial low is established, and then there is a retracement of those values back to the neckline.
Following a return to its previous level, the price enters a bearish trend and continues to go lower, eventually reaching a new low.
When prices move back to the neckline after producing the second low in this pattern, the creation of this pattern is considered to be complete.
After the prices have broken through the resistance level or the neckline, the bullish trend reversal will have been confirmed, and traders will be able to open a long position.
At the end of a downtrend, there is a double bottom. As the price goes down, making lower highs and lower lows, it bounces back up before going back down to retest the previous low.
As a basic rule of technical analysis, a low that has been touched twice becomes a support level. This means that sellers can't make a new low that is lower than the previous low.
This gives buyers a chance to push the price up. Because of this, we now have two lows, or bottoms, that look like the letter "W."
On the other hand, the pattern is thought to start at the highest point of the bounce back after the first bottom. At the top of a rebound, where it is tallest, a horizontal line is drawn. This line is called the "neckline."
Since it's almost impossible to get two bottoms at exactly the same price, as long as these two lows are at about the same price, that's enough to prove a pattern.
The double bottom pattern is thought to be a bullish reversal pattern because it starts with a downtrend and ends with an uptrend.
Once the price action breaks above the neckline, the pattern is in play. So, the price action goes from making lower lows and lower highs to starting a trend of higher lows and higher highs.
People usually think that two consecutive bottoms with a short time between them can be a problem. This is because it shows that the downtrend is very strong, which means that the current bearish trend is likely to continue.
Because of this, the best double-bottom patterns have a certain amount of time between the two lows.
How to find the double bottom pattern on a chart, step by step:
A double bottom pattern is one of the most powerful patterns to predict a change in direction. It's not a very common pattern because it has two bottoms.
Still, once the pattern is found, it is very good at predicting when the direction of the trend will change.
Its best feature is that you can play against levels that are easy to understand. The risk is shown by the neckline, and it also helps figure out where to take profit once the pattern is formed. So, it is very important to draw the double bottom correctly.
 Top THREE Award-Winning Brokers in 2022 Top THREE Award-Winning Brokers in 2022 LiteFinance |IC Markets|Exness |
The main problem with the double-bottom pattern is that it is a strategy that goes against the crowd. Don't forget that the overall trend is down and that we are playing the "long" trade here.
So, there is always the chance that the market will keep going in the same direction. Before getting into the market, it's important to look at supporting factors in the context of other technical indicators.
Double bottom formations are among the most important chart patterns for spotting longer-term changes in trends, signifying that a substantial low has been hit for the foreseeable future.
After the second bottom has been reached, the pattern normally implies a 10% to 20% comeback, but there may be an additional upside if the fundamental environment has shifted in favour of security.
For example, a strong forecast for future earnings might spark a fresh rise. Identifying double bottoms visually using reasonably long-term charts is most effective (daily and weekly). The lows do not have to be identical, but they should be within 3% to 4% of one another.
The first retracement's highs (about 10%) serve as the lowest measured objective level for the potential for an upswing. If the bottom is within 3% to 4% of the previous low, the pattern is concluded by a retreat and a second test of downside support.
After the formation of a double-bottom pattern, traders should watch for upward price movement. If the high in the centre of the pattern is surpassed after the second bottom has formed, it indicates more upward potential and maybe the beginning of a new uptrend.
Read More From StreetCurrencies:
What Is Double Bottom? -StreetCurrencies
EUR/USD Technical Analysis And Trading Strategy For The Day -StreetCurrencies
Walmart Targets Young Shoppers With Roblox Experiences -StreetCurrencies


